SocScape - providing acess to high resolution grids
SocScape (Social Landscape) is a research project which provides open access to high resolution (30 m) population, subpopulation (separate race/ethnicity group) and racial diversity grids for the entire conterminous United States for 1990, 2000, 2010. This project has been developed in the Space Informatics Lab (sil.uc.edu) at the University of Cincinnati by dr Tomasz Stepinski, dr Anna Dmowska and dr Pawel Netzel.
High resolution grids are available for download using SocScape - GeoWeb application or SocScape data website, which provide data for counties and MSA. For more information please see also the SocScape user guide and SocScape tutorial: "Working with demographic grids in QGIS."
SocScape – exploring U.S population/racial composition online
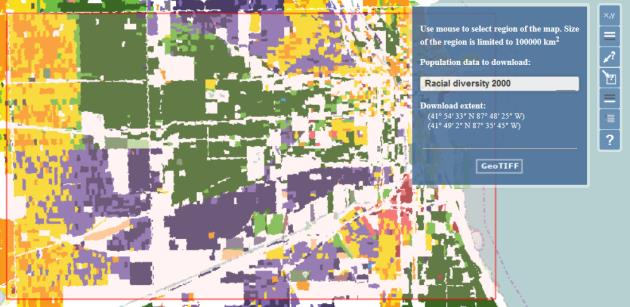 SocScape is a GeoWeb application for exploring and detecting change of population density and racial diversity over the entire U.S. It allows to download data for selected region (up to 100 000 km2).
Data availability: total population and racial diversity grids for 1990, 2000, 2010
SocScape data – downloading data for counties and MSA
(http://socscape.edu.pl)
 SocScape data website provides data for each county and for 363 MSA as a zip archive. Data are saved as GeoTiff and shapefiles (change map) and can be opened in GIS software (ArcGIS, QGIS).
Data avalability: total population, subpopulation (race/ethnicity), racial diversity grids for 1990, 2000, 2010. Change maps are available for urban areas within 363 MSA for 1990-2000, 2000-2010, 1990-2010 comparison.
Gridded-based racial dot map
Racial dot maps are calculated based on 2010 high resolution demographic grids for each county in the conterminous U.S. Data are organized as a zip archive for each state in the conterminous U.S. Each zip archive contain racial dot maps for counties in this state.
Racial dot map includes seven separate racial/ethnicity groups: (non Hispanic) whites, blacks, Asians, Native Americans, Pacific Islander, group who declared "Some other race" and Hispanic origin regardless the race category. Racial category is stored in race_cat field in the attribute table.
For more information please see also the Tutorial: "Working with racial dot map in QGIS".
Download data
Download R script for calculation racial dot map from gridded data
Others about SocScape
- UC Magazine: UC map captures diversity of America by Michael Miller
- Geographical Magazine: New maps of racial diversity in the United States by Laura Core
- Quartz: An astrophysicist used NASA data to make an insanely detailed map of US racial diversity
- United Press International (UPI): New digital map details shifting demographics in United States by Brooks Hays
- googlemapsmania: The diversity map of the United States
- Dayli Detroit: New Maps Show 20 Years Of Racial Change In Metro Detroit In Sharp Detail By Daily Detroit Staff